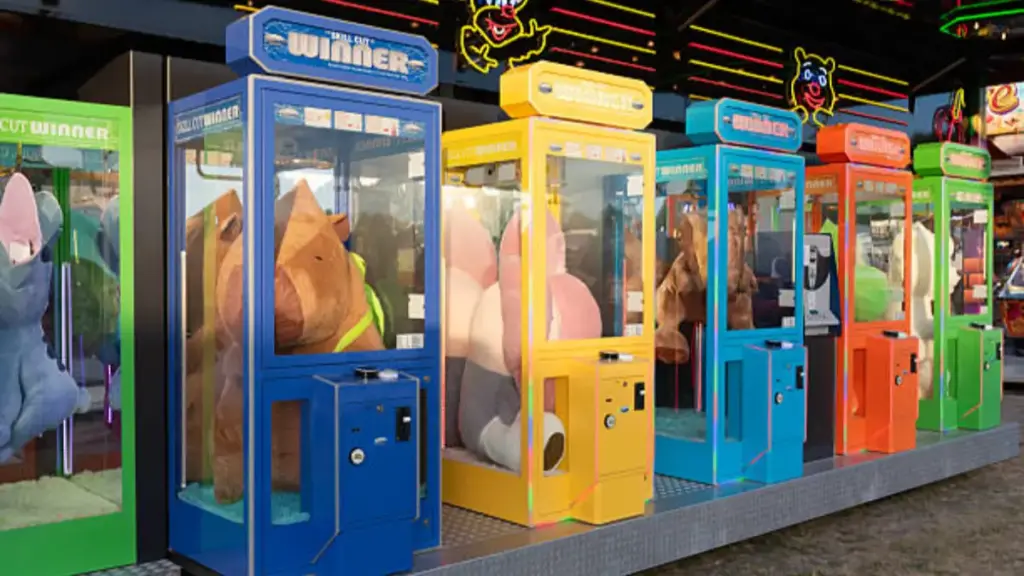
O claw machine business payback period determines whether your investment becomes a fast-return asset or a long-term financial burden. This article explains how to calculate real payback time, what drives ROI differences, and which hidden costs most often slow down returns, helping operators make more accurate investment decisions and avoid underperforming locations.
As a professional manufacturer with extensive experience in global claw machine production and operations, we analyze how revenue, location quality, estratégia de prêmios, and cost control directly affect ROI speed, showing why payback periods can range from 3 para superar 24 months depending on real operating conditions.
Understanding the Real Payback Period Model
The payback period helps operators evaluate how quickly a claw machine converts initial investment into recovered capital under real operating conditions.
Payback Period Formula and Investment Recovery Logic
The payback period shows how long it takes to recover the original investment using net operating profit.
The basic calculation follows a simple structure:
Payback Period = Total Initial Investment ÷ Monthly Net Profit
No entanto, in real operations, monthly net profit is not stable. It shifts based on traffic patterns, pricing control, prize cost efficiency, and machine uptime performance.
A key distinction must be clear:
- Capital recovery speed: how fast investment returns
- Profit generation speed: how much revenue is produced
A machine may generate daily cash flow but still recover slowly when operating costs remain high or margins are weak.
Why Claw Machine ROI Is Highly Variable
Claw machine returns fluctuate because revenue depends on human behavior and location conditions rather than fixed financial rules.
Three core factors explain this variability:
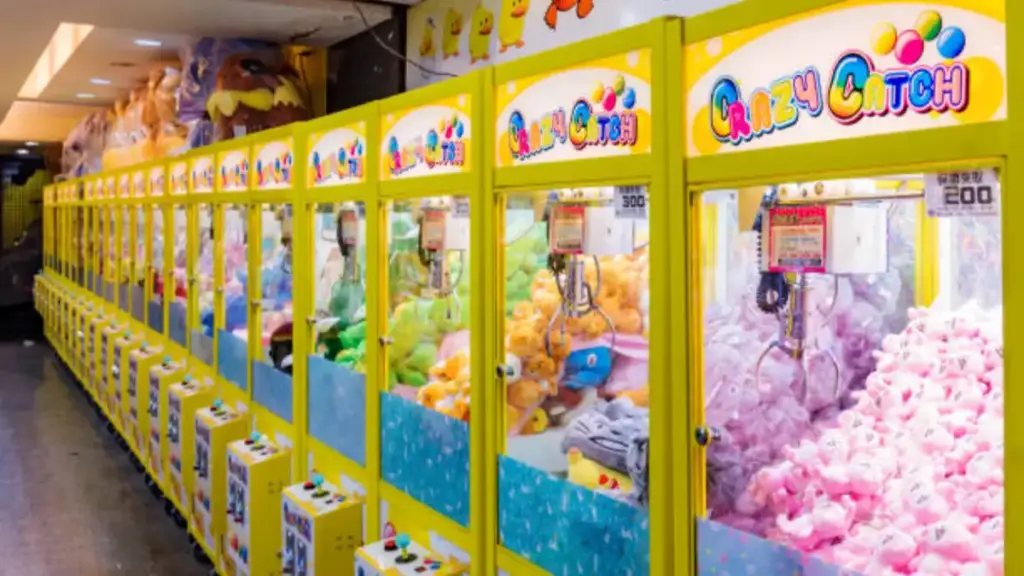
- Location dependency: Identical machines can produce multiple times difference in revenue depending on placement quality
- Emotional spending behavior: Players respond to entertainment value rather than necessity, which creates unpredictable demand cycles
- Operational control sensitivity: Small adjustments in win rate, preços, or prize selection can significantly change conversion rates
Por exemplo, the same machine placed near a mall entrance often attracts impulse play, while the same unit in a low-visibility corner may generate minimal engagement.
This makes claw machine ROI a behavior-driven investment model where performance depends on environment and execution rather than equipment alone.
For additional information, please refer to Franchise da máquina de garra vs negócios independentes for a deeper explanation.
Industry Payback Benchmarks Across Different Scenarios
Before evaluating investment decisions, it is important to understand how payback outcomes differ across operating environments.
| Performance Level | Monthly Net Profit | Período de retorno |
|---|---|---|
| Weak Location | Low traffic, limited engagement | 12–24+ months |
| Standard Mall Setup | Stable traffic with moderate conversion | 6–12 months |
| High-Traffic Entertainment Zone | High engagement and repeat play behavior | 3–6 months |
What Drives Revenue in a Claw Machine Business

Revenue in a claw machine business depends on how people discover the machine, how they interact with it, and how often they continue playing during each visit.
Location Traffic and Conversion Rate as Core Revenue Engine
Revenue starts with exposure, but only becomes real income when players decide to engage. Two key metrics define this process:
- Foot traffic: how many people pass the machine
- Conversion rate: how many of them actually play
Even in high-traffic areas, weak engagement design can lead to poor results. Em contraste, a medium-traffic location with strong conversion often performs better.
Conversion is mainly influenced by physical and visual optimization:
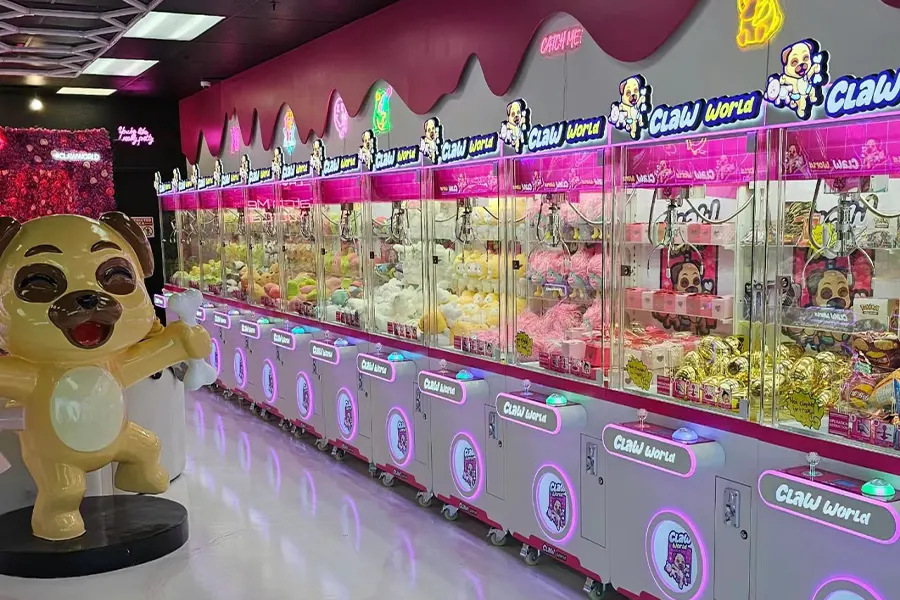
- Placement strategy: Machines positioned near entrances or natural stopping points attract more impulse plays
- Lighting design: LED visibility increases attention in crowded environments
- Prize presentation: Clear and attractive display builds instant interest
- Sensory triggers: Light movement and sound increase interaction probability
A 20–30% improvement in conversion rate can significantly increase monthly revenue and shorten the payback cycle.
Pricing Strategy and Repeat Play Behavior
Pricing affects entry behavior, but revenue depends more on how many times a player continues during one session. Most machines operate in the $1.5–$3.0 per play faixa, depending on venue type and prize value.
No entanto, profitability is driven by session depth rather than single transactions. A single visitor often generates 2–6 plays per visit, depending on engagement design and perceived winning chances.
To improve session value, operators use structured pricing and behavioral design:
- Bundle pricing: Offers like “2 plays for $3” reduce hesitation and increase perceived value
- Early-win setup: Initial success encourages continued attempts
- Balanced difficulty control: Keeps the game challenging but still rewarding
The main goal is to maximize total revenue per visitor session, not just price per play.
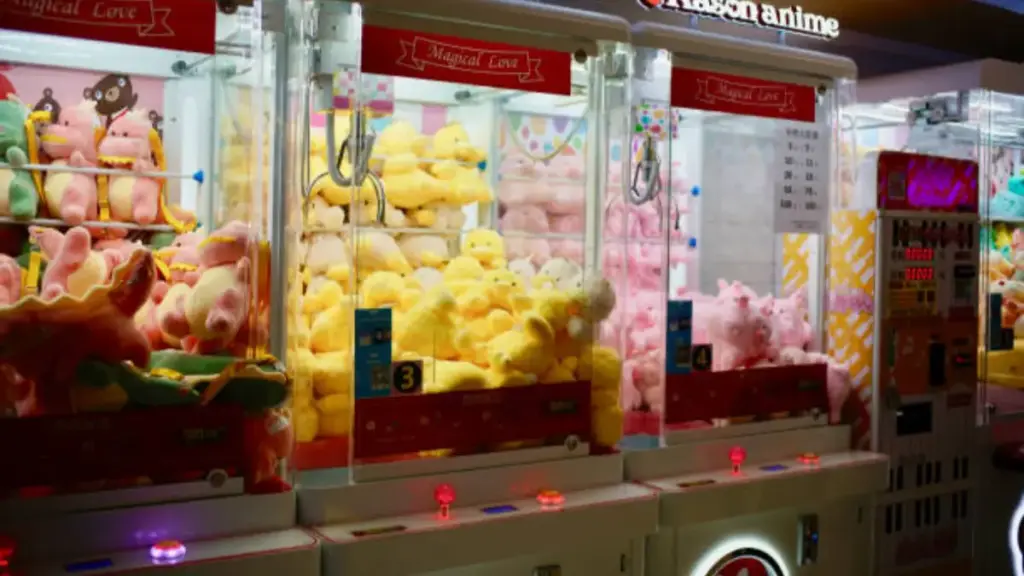
Prize Mix, Taxa de vitória, and Player Psychology
Prize design is the emotional core of revenue generation. It directly affects how long players stay and how much they spend.
Three key factors shape performance:
- Prize attractiveness: visual appeal that drives initial engagement
- Win probability (taxa de pagamento): how often players experience success
- Perceived fairness: whether the game feels enjoyable and worth continuing
Prize structures are usually layered:
- Low-cost plush toys: Stable margins and consistent engagement
- Licensed or premium items: Higher attraction but lower margin control
- Seasonal prizes: Short-term traffic spikes and promotional boosts
Win rates are typically set between 8%–15%, balancing profitability with player satisfaction.
A well-designed prize system not only improves engagement but can also increase monthly revenue by 20–40%, directly improving overall ROI and shortening the payback period.
Your Turnkey Path to Arcade Profitability.
Cost Structure That Determines Real Payback Speed

Understanding cost structure is essential for evaluating how fast a claw machine can recover its initial investment and reach stable profitability.
Initial Investment Breakdown (Máquina + Setup + Logística)
The initial investment includes several key components that define the real entry barrier for a claw machine business.
- Machine cost: Varies based on design, características, and production quality
- Shipping and logistics: Includes transport, handling, and delivery arrangements
- Initial prize stock: Required inventory to start operations smoothly
- Setup and installation: Adjustments based on venue conditions and technical needs
Overall investment is mainly influenced by qualidade da máquina, logistics complexity, and deployment requirements rather than a fixed number.
Location Rent and Revenue Share Pressure
Location cost is one of the most important factors that directly reduces monthly profit and slows down investment recovery.
Common commercial models include:
- Fixed rent model: Typically $100–$1,000 per month depending on venue size and traffic
- Revenue share model: Usually 15%–30% of gross revenue paid to the location owner
Revenue sharing is widely used because it reduces entry risk, but it also creates continuous pressure on margins. Even a small difference in commission rate can significantly change long-term ROI performance.
If you want to understand this in more detail, you can also read our guide on Melhores locais para aluguel de máquina de garra
Prize Cost and Operational Maintenance Burden
Ongoing operational costs mainly come from prize replenishment and machine maintenance, both of which directly affect net profitability.
- Prize cost: Usually accounts for 15%–35% of revenue depending on win rate control and sourcing efficiency
- Maintenance cost: Typically $20–$200 per machine per month, covering mechanical repairs, lighting replacement, and wear
- Operational impact: Maintenance directly influences uptime, and downtime reduces daily revenue performance
Real-World Payback Scenarios

Payback performance varies significantly across different operating environments, where location quality, traffic density, and engagement levels directly shape financial outcomes.
High-Traffic Tourist or Entertainment Locations (3–6 Months)
In high-performing environments such as tourist attractions, arcadas, or entertainment hubs, claw machines benefit from strong exposure and emotional engagement.
These locations typically share three characteristics:
- High visibility flow: Continuous movement of potential players
- Strong emotional response: Visitors are more willing to spend on entertainment
- High repeat interaction: Players often make multiple attempts in a single visit
Como resultado, monthly net profit in these locations can reach strong levels, and investment recovery may occur within a short cycle of 3–6 months.
This performance level represents the most efficient ROI scenario, but it requires precise placement and consistent operational control.
Standard Mall Operations (6–12 Months)
Most claw machine businesses operate in shopping malls, where performance remains stable but less aggressive compared to premium environments.
Key characteristics include:
- Moderate and stable traffic flow
- Mixed spending behavior across different customer groups
- Balanced conversion performance without extreme peaks
In these conditions, payback usually falls within a 6–12 month faixa, which is widely considered a healthy and sustainable ROI cycle for long-term operations.
This model is often preferred by operators seeking predictable cash flow rather than rapid expansion.
Low-Traffic or Poor Placement Cases (12–24+ Months)
Weak placement directly exposes the limitations of even well-designed machines.
Typical issues include:
- Low visibility that reduces spontaneous engagement
- Weak interaction rate due to limited foot flow
- Minimal repeat activity from players
Under these conditions, monthly profit often remains low, and payback periods extend significantly beyond standard expectations. Em alguns casos, recovery may take more than 12–24 months or fail to reach break-even.
This scenario clearly shows that location quality has a stronger impact on ROI than machine specifications alone.
How to Accelerate ROI in Practice
Improving payback speed requires coordinated adjustments in location quality, pricing strategy, e eficiência operacional, where small changes can produce significant financial impact.
Location Selection and Revenue Share Optimization
ROI performance starts with choosing the right location and controlling fixed cost pressure from revenue sharing agreements.
Key actions include:
- Target high-traffic zones: Focus on malls, entertainment venues, and leisure centers with consistent visitor flow
- Avoid low-conversion spaces: Even high foot traffic is ineffective if engagement is weak
- Control revenue share levels: Keep commission structures within a sustainable range when negotiating agreements
Pricing and Win Rate Optimization Strategy
Revenue efficiency depends on how pricing and game difficulty influence player behavior over time.
Effective optimization includes:
- Adaptive pricing strategy: Adjust price levels based on customer sensitivity and venue type
- Bundle-based offers: Encourage multiple plays per session instead of single transactions
- Balanced win rate control: Maintain fairness while protecting margin stability
These adjustments shift focus from single-play revenue to overall session performance, improving engagement quality and supporting more stable ROI outcomes.
Prize Strategy and Operational Efficiency Control
Prize management and operational monitoring determine whether revenue gains can be sustained over time.
Core practices include:
- Core inventory strategy: Use high-margin plush toys as the foundation of machine offerings
- Dynamic prize rotation: Introduce premium or themed items to maintain engagement interest
- Seasonal adjustment planning: Align prize mix with holidays or demand cycles
Operational monitoring helps operators quickly identify underperforming machines and make timely adjustments in placement or prize configuration, ensuring more stable long-term ROI performance.
Investment Strategy and Scalable Growth Model
Scaling a claw machine business requires shifting from individual machine performance to a structured portfolio system that improves overall return stability and reduces operational risk.
Why Single-Machine ROI Is Not Enough for Scaling Decisions
A single machine only reflects local performance, but it does not represent business scalability or long-term stability.
Operators who focus on growth evaluate performance from a broader perspective:
- Route-level performance: Total revenue across multiple machines matters more than individual results
- Average ROI balance: Consistent returns across machines reduce financial volatility
- Location distribution strategy: Diversified placement reduces dependency on a single market
This portfolio-based approach helps operators reduce risk and avoid over-reliance on isolated high-performing locations.
Machine Cost vs Location Quality Trade-off Strategy
Investment efficiency depends more on placement quality than equipment price level.
A core operating principle is:
A well-placed lower-cost machine can outperform a premium machine in a weak location
This is because revenue generation is driven more by foot traffic and engagement than hardware specification alone.
For scaling decisions, operators should prioritize:
- Location strength over machine cost
- Traffic quality over visual upgrades
- Conversion potential over equipment features
Building a Scalable Claw Machine Route System
Scalability depends on turning individual machines into a coordinated operational system rather than independent units.
Key structural elements include:
- Cluster deployment strategy: Concentrate machines in high-performing zones to increase operational efficiency
- Standardized system design: Keep pricing models and prize logic consistent across locations
- Performance-based rotation: Move underperforming machines based on real revenue data
When these elements work together, the business shifts from single-machine income to a networked revenue system, where total performance becomes more stable and predictable over time.
Perguntas frequentes
What hidden costs are commonly excluded from payback calculations?
Standard payback calculations give you those rosy 3-8 month estimates because they typically only factor in the machine price and gross revenue. They conveniently leave out real-world costs like shipping and installation, business licenses, o 15-30% revenue share you’ll owe the location, ongoing maintenance and spare parts, payment processing fees, and the labor it takes to collect cash and restock prizes.
How does machine utilization affect long-term investment performance?
Machine utilization—the number of paid plays per day—is everything. In prime locations like malls or family entertainment centers, high utilization can get you a payback in 3-8 meses. But if your machine is in a bad spot with low utilization, that payback period easily stretches beyond 12 ou 18 meses. At that point, fixed costs like rent and maintenance eat up so much of your revenue that the investment often becomes unviable.
How should operators account for machine depreciation?
You need to treat depreciation as a fundamental cost in your analysis, not just an accounting entry. Use the straight-line method: divide the machine’s full acquisition cost over its useful economic life, which is typically 3-7 anos. This gives you a monthly depreciation figure. This number represents the capital that your profits must recover to ensure the investment is self-sustaining and to calculate a realistic payback period.
When does reinvestment become more profitable than expansion?
Reinvesting in your existing machines beats expanding to new ones when the return is higher. This tipping point often occurs once you’ve already secured the best locations. Spending on better prizes, cabinet upgrades, or local marketing can yield a payback on that specific spend in just 2-4 meses. That’s a much faster return than the 6-12 month payback for a new machine in a lower-traffic area.
Considerações Finais
The real payback period of a negócio de máquina de garra is never fixed, as it depends on a combination of location quality, pricing structure, estratégia de prêmios, and daily operational decisions that directly influence ROI performance.
In real operations, payback can range from 3–6 months in strong locations para superar 12–24 months in weak environments, showing how sensitive results are to execution quality rather than machine capability alone. As a managed entertainment system, long-term success depends on building the right structure, and working with an experienced manufacturer such as TongRu Claw Machine can help improve machine stability and long-term ROI consistency.